abstract halftone upward arrows on a purple gradient background, symbolizing upward motion. - graph theory stock illustrationsAbstract halftone upward arrows on a purple gradient background, symbolizing upward motion.Arrow Symbol, Traffic Arrow Sign, Backgrounds
tech trends futuristic planning drafting blueprint background abstract - graph theory stock illustrationsTech Trends Futuristic Planning Drafting Blueprint Background AbstractPattern, Blueprint, Backgrounds
vertical arrow symbols, abstract background - graph theory stock illustrationsVertical Arrow Symbols, Abstract BackgroundArrow Symbol, Abstract, Backgrounds
growth - line vector icon set. pixel perfect. editable stroke. the set includes a personal growth, revenue growth, rocket launch, percentage growth, presentation, investment, mountain peak, positive emotion, moving up. - graph theory stock illustrationsGrowth - line vector icon set. Pixel perfect. Editable stroke. The set includes a Personal Growth, Revenue Growth, Rocket Launch, Percentage Growth, Presentation, Investment, Mountain Peak, Positive Emotion, Moving Up.Icon Symbol, Business, Investment
internet marketing icon - acme series - graph theory stock illustrationsInternet Marketing Icon - Acme SeriesIcon Symbol, Technology, Marketing
abstract financial graph with uptrend in stock market on blue colour background. abstract growing financial graph chart background. stock market increasing background. - graph theory stock illustrationsAbstract financial graph with uptrend in stock market on blue colour background. Abstract growing financial graph chart background. Stock market increasing background.Backgrounds, Graph, Data
ecommerce isometric icons - graph theory stock illustrationsEcommerce isometric iconsThree Dimensional, Illustration, Marketing
performance editable stroke icon set - graph theory stock illustrationsPerformance Editable Stroke Icon SetIcon Symbol, Expertise, Business
business strategy - thin line vector icon set. pixel perfect. editable stroke. the set consists of icons such as strategy, business plan, business target, teamwork, partnership, rocketship, revenue, artificial intelligence. - graph theory stock illustrationsBusiness Strategy - thin line vector icon set. Pixel perfect. Editable stroke. The set consists of icons such as Strategy, Business Plan, Business Target, Teamwork, Partnership, Rocketship, Revenue, Artificial Intelligence.Icon Symbol, Handshake, Chess
mobile device data statistics phone - graph theory stock illustrationsMobile Device Data Statistics PhoneData, Analyzing, Dashboard - Visual Aid
performance icons - line series - graph theory stock illustrationsPerformance Icons - Line SeriesStrength, Speed, Performance
statistics data and analytics software laptop application - graph theory stock illustrationsStatistics Data and Analytics Software Laptop ApplicationData, Analyzing, Laptop
business presentation icons - classic line series - graph theory stock illustrationsBusiness Presentation Icons - Classic Line SeriesIcon Symbol, Presentation - Speech, Public Speaker
business strategy line icons - graph theory stock illustrationsBusiness Strategy Line IconsIcon Symbol, Business, Icon Set
hand drawn design elements - graph theory stock illustrationsHand drawn design elementsDesign Element, Felt Tip Pen
machine learning web banner template - graph theory stock illustrationsMachine Learning Web Banner TemplateArtificial Intelligence, Concepts, Technology
business icons - smart line series - graph theory stock illustrationsBusiness Icons - Smart Line SeriesExpertise, Light Bulb, Business
digital marketing team - graph theory stock illustrationsDigital marketing teamIllustration, People, Social Media
five colorful elements to arrow. concept of 5 successive steps of business project development process. minimal infographic design template. modern flat vector illustration for data visualization - graph theory stock illustrationsFive colorful elements to arrow. Concept of 5 successive steps of business project development process. Minimal infographic design template. Modern flat vector illustration for data visualizationInfographic, Arrow Symbol, Timeline - Visual Aid
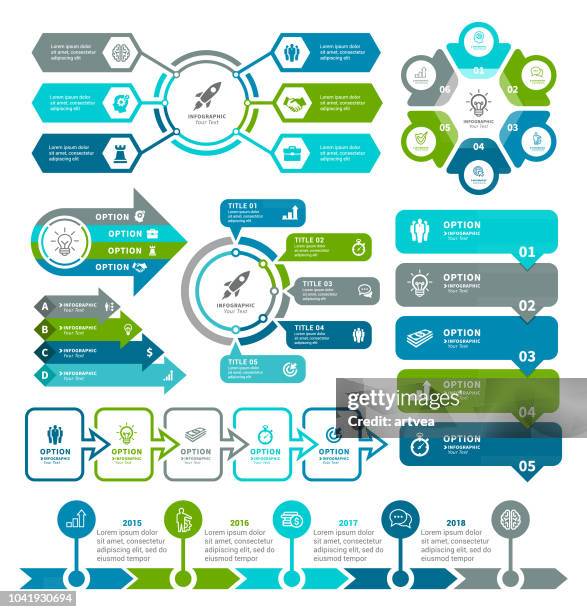
business diagrams and infographic elements. - graph theory stock illustrationsBusiness diagrams and Infographic Elements.Infographic, Diagram, Chart
boost sales concept - graph theory stock illustrationsBoost Sales ConceptBusiness, Illustration, Investment
signal analysis icon - thin line vector. pixel perfect. editable stroke. ideal for data monitoring, signal processing, and analytical projects - graph theory stock illustrationsSignal Analysis Icon - Thin Line Vector. Pixel Perfect. Editable Stroke. Ideal for Data Monitoring, Signal Processing, and Analytical ProjectsIcon Symbol, Surveillance, Computer Monitor
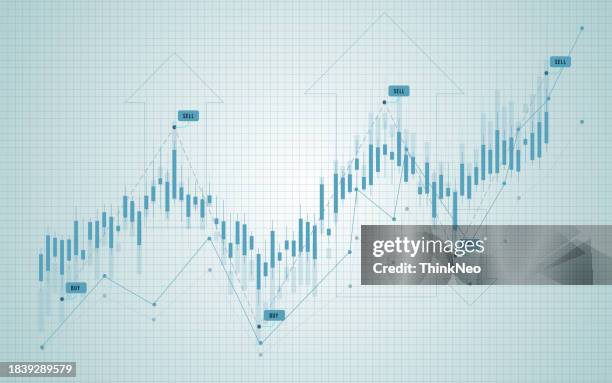
business candle stick graph chart of stock market investment trading, bullish point, bearish point. - graph theory stock illustrationsBusiness candle stick graph chart of stock market investment trading, Bullish point, Bearish point.Graph, Chart, Data
green stock market rising arrows chart vector illustration - graph theory stock illustrationsGreen Stock Market rising arrows chart vector illustrationGraph, Backgrounds, Abstract
data analysis chart graph 3d statistics background - graph theory stock illustrationsData Analysis Chart Graph 3D Statistics BackgroundThree Dimensional, Dashboard - Visual Aid, Financial Planning
presentation - set of vector linear icons. pixel perfect. editable stroke. the set includes a presentation, business meeting, conference, seminar, speaker, teamwork, leadership, web conference, projector, training class, discussion, dashboard. - graph theory stock illustrationsPresentation - set of vector linear icons. Pixel perfect. Editable stroke. The set includes a Presentation, Business Meeting, Conference, Seminar, Speaker, Teamwork, Leadership, Web Conference, Projector, Training Class, Discussion, Dashboard.Presentation - Speech, Icon Symbol, Slide Show
ai vs natural intelligence confrontation - graph theory stock illustrationsAi Vs Natural Intelligence ConfrontationArtificial Intelligence, People, Concepts
business infographics. process with 4 steps, options, hexagons. vector template. stock illustration four objects, number 4, infographic, steps, part of - graph theory stock illustrationsBusiness infographics. Process with 4 steps, options, hexagons. Vector template. stock illustration Four Objects, Number 4, Infographic, Steps, Part OfInfographic, Number 4, Puzzle
collage style profit or growth finance and business sales increasing line chart concept with pointing human hand gesture - graph theory stock illustrationsCollage style profit or growth finance and business sales increasing line chart concept with pointing human hand gestureGraph, Business
growth glyph solid icons. containing increase, success, performance, statistics, analysis, chart, graphic solid icons collection. vector illustration. for website design, logo, app, template, ui, etc. - graph theory stock illustrationsGrowth glyph solid icons. Containing increase, success, performance, statistics, analysis, chart, graphic solid icons collection. Vector illustration. For website design, logo, app, template, ui, etc.Icon Symbol, Graph, Moving Up
abstract financial graph with uptrend in stock market on blue colour background. abstract growing financial graph chart background. stock market increasing background. - graph theory stock illustrationsAbstract financial graph with uptrend in stock market on blue colour background. Abstract growing financial graph chart background. Stock market increasing background.Backgrounds, Investment, Chart
presentation vector infographic template with 4 steps stock illustration infographic, list, bar graph, icons, chart - graph theory stock illustrationsPresentation Vector infographic template with 4 steps stock illustration Infographic, List, Bar Graph, Icons, ChartInfographic, Steps, Staircase
numeric information template - graph theory stock illustrationsNumeric Information TemplateInfographic, Number, Steps
performance management editable icons - graph theory stock illustrationsPerformance Management Editable IconsIcon Symbol, Speed, Role Model
ai mind power concept - graph theory stock illustrationsAi Mind Power ConceptArtificial Intelligence, Data, Learning
trigonometry math class doodle - graph theory stock illustrationsTrigonometry Math Class doodleNote Pad, Mathematical Symbol, Backgrounds
different hands in halftone assembling a bubble speech - graph theory stock illustrationsDifferent hands in halftone assembling a bubble speechCommunication, Discussion, Speech Bubble
business icons - graph theory stock illustrationsbusiness iconsIcon Symbol, Multi Colored, Flat Design
arrows moving up abstract background - graph theory stock illustrationsArrows Moving Up Abstract BackgroundBackgrounds, Arrow Symbol, Traffic Arrow Sign
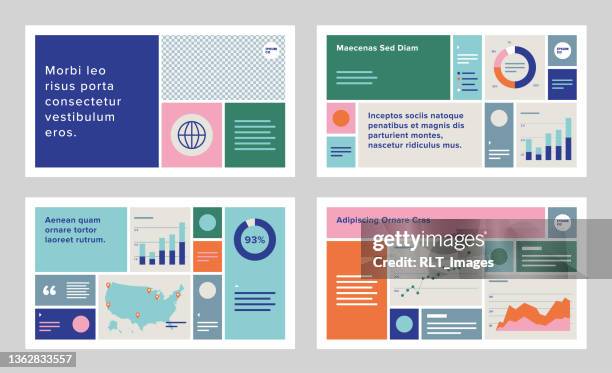
modular presentation design template with modern geometric graphics - graph theory stock illustrationsModular presentation design template with modern geometric graphicsInfographic, Data, Plan - Document
performance line icon set - graph theory stock illustrationsPerformance Line Icon SetIcon Symbol, Urgency, Improvement
modern data artificial intelligence statistics technology abstract background - graph theory stock illustrationsModern Data Artificial Intelligence Statistics Technology Abstract BackgroundAbstract, Artificial Intelligence, Dashboard - Visual Aid
abstract illustration depicting business growth with upward arrows on dark background - graph theory stock illustrationsAbstract Illustration Depicting Business Growth with Upward Arrows on Dark BackgroundArrow Symbol, Moving Up, Chart
modern arrow growth concept with multicolor geometric shapes - graph theory stock illustrationsModern Arrow Growth Concept with Multicolor Geometric ShapesArrow Symbol, Traffic Arrow Sign, Abstract
hand drawn design elements - graph theory stock illustrationsHand drawn design elementsHighlighter Pen, Vector, Arrow Symbol
abstract digital landscape composed of colorful data lines and points on purple background - graph theory stock illustrationsAbstract Digital Landscape Composed of Colorful Data Lines and Points on Purple BackgroundAbstract, Data, Technology
abstrac blue flowing lines technology background - graph theory stock illustrationsabstrac blue flowing lines technology backgroundTechnology, Wave Pattern, Vector
investor pitch presentation flat illustration, team discussing business growth - graph theory stock illustrationsInvestor Pitch Presentation Flat Illustration, Team Discussing Business GrowthPresentation - Speech, Cartoon, Illustration
cover design with construction tools icon set - graph theory stock illustrationsCover design with Construction tools icon setBook Cover, Design, Toolbox
speedometer gauge dial vector icon isolated - graph theory stock illustrationsSpeedometer gauge dial vector icon isolatedSpeedometer, Performance, Speed
profit or increase sales creative idea business concept in retro collage style with human hand holding arrows going in different directions - graph theory stock illustrationsProfit or increase sales creative idea business concept in retro collage style with human hand holding arrows going in different directionsArrow Symbol, Graph, Newspaper
simple set of data analytics related vector thin line icons. outline symbol collection - graph theory stock illustrationsSimple Set of Data Analytics Related Vector Thin Line Icons. Outline Symbol CollectionIcon Symbol, Data, Technology
data statistics analysis charts graphs blue software windows - graph theory stock illustrationsData Statistics Analysis Charts Graphs Blue Software WindowsAnalyzing, Data, Big Data
learn and lead solid icons collection.containing team, ideas, training, motivation, leadership, success, business, growth, encourage, coaching, direction, knowledge, innovation, mentorship, strategy - graph theory stock illustrationsLearn And Lead solid icons collection.Containing Team, Ideas, Training, Motivation, Leadership, Success, Business, Growth, Encourage, Coaching, Direction, Knowledge, Innovation, Mentorship, StrategyIcon Symbol, Initiative, Learning
sales data and economic growth graph on hologram screen. business strategy and digital data, business technology, digital marketing. business financial hud background. - graph theory stock illustrationsSales data and economic growth graph on hologram screen. Business strategy and digital data, business technology, digital marketing. Business financial hud background.Data, Graph, Analyzing
risk control strategy concept. - graph theory stock illustrationsRisk control strategy concept.Concepts, Investment
business diagrams and infographic elements - graph theory stock illustrationsBusiness diagrams and Infographic ElementsInfographic, Arrow Symbol, Chart